The first version of the Normaliser was launched in June 2007, and immediately got a bit of coverage on influential blogs, which brought it a decent amount of traffic.
After two years of solid service, we rebuilt the application from scratch using open-source technologies and refreshed the design.
Having been a user of last.fm for a number of years, I often found it frustrating that my listening charts didn't accurately reflect my listening habits. The problem was that last.fm uses the "track" as the atomic unit of attention - and last.fm's listening charts are sorted based on how many tracks you have listened to by a particular artist.
This approach can throw up some problems. For instance, some artists tend to record shorter tracks than others. For instance, spending an hour listening to Arctic Monkeys will probably log twice as many tracks as the same time spent listening to Pink Floyd.
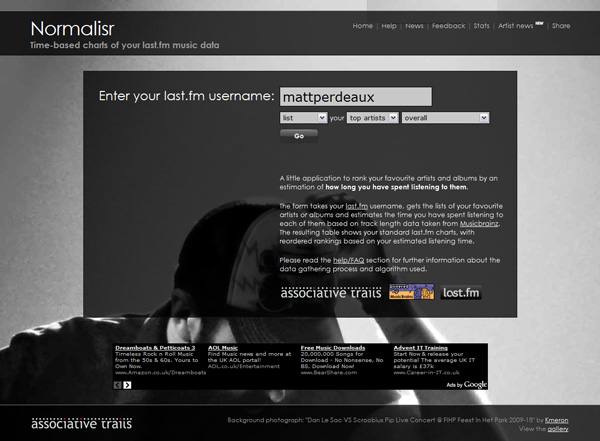
After grumbling at length in a blog post, I realised that in the age of open data it shouldn't be too much hassle to knock together a little app to apply the "normalisation" calculation I discussed. The resulting application does the following:
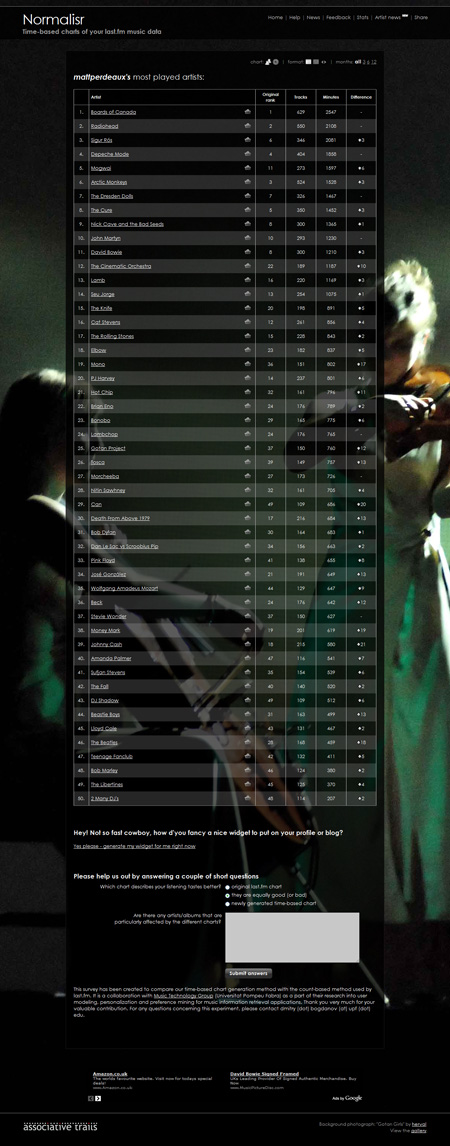
The resulting table shows top artists ranked based on the estimated time spent listening to them.
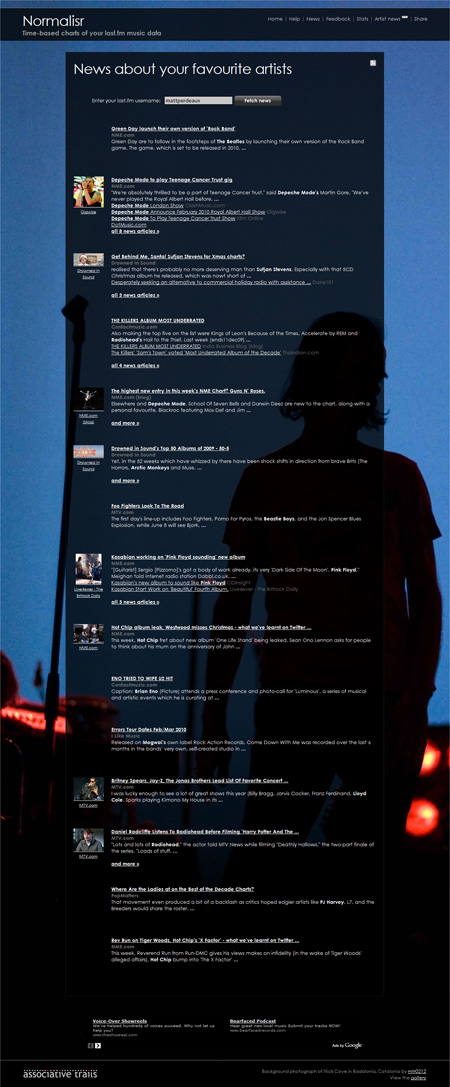
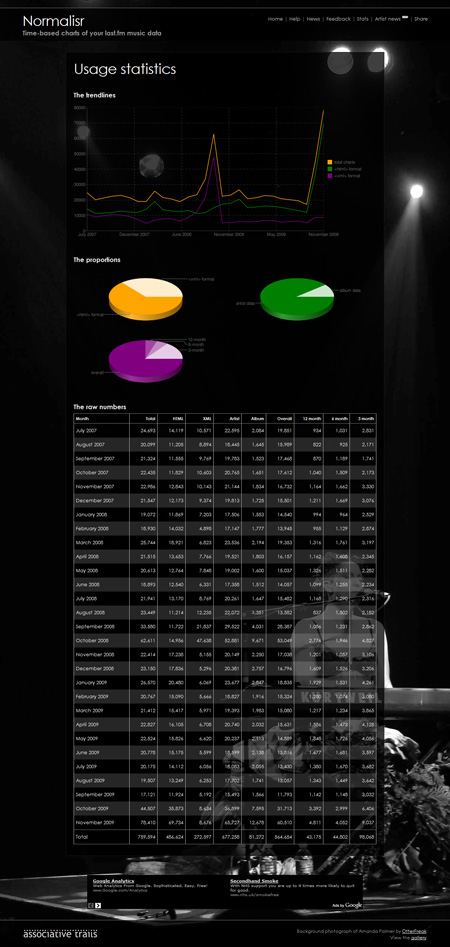
The first version of the Normaliser was launched in June 2007, and immediately got a bit of coverage on influential blogs, which brought it a decent amount of traffic. After two years of solid service, we rebuilt the application from scratch using open-source technologies and refreshed the design.
We are regularly adding new functionality, including graphical widgets allowing users to display their normalised charts on their own websites and blogs.
In November 2009, we started a small collaboration with the Music Technology Group at the Universitat Pompeu Fabra (Barcelona, Spain).
Python, Django, MySQL, RSS, XHTML 1.0 Strict, CSS, RSS, jQuery, Google Chart API. Ubuntu, Apache, WSGI, Nginx, Munin, Monit.

Python, Django, MySQL, RSS, XHTML 1.0 Strict, CSS, RSS, jQuery, Google Chart API. Ubuntu, Apache, WSGI, Nginx, Munin, Monit.